


![[object Object]](https://images.collegedunia.com/public/asset/img/studyabroad/collegebanner/Rohit_Soni_1.png?tr=c-force)
It's a dream for every child to secure a place at the University of Cambridge. Applications pour in from every corner of the world. But to dream is not all, it requires hard work, mental preparation and skills.Students who are well qualified, making both open applications or applying directly to a college does not affect from getting a chance of getting into the college. The main reason is that the University of Cambridge has a very rigorous procedure, they compare all applicants for each subject before the selection decision is finalised. Strong meritorious students who could not make it into the college due to high competition can be made an offer via the pool. Colleges prefer and admit strong applicants through the pool than weaker applicants who had applied directly to the college.
Everyone aspiring for getting admitted under the University of Cambridge, always thinks about the acceptance rate of the university. The university and colleges under the university always try to select students of the highest academic ability and potential. There is a strong element of cross college moderation.
Admissions at the University of Cambridge, is solely on academic criteria i.e., a student’s ability and their potential. At the University of Cambridge every individual is assessed on different things in different people for different courses. There is no magical formula that will open gates of University of Cambridge for students, but academic ability and potential will surely create difference.
The University of Cambridge looks for signs in students the ability to think critically and independently. Students should logically prove their thoughts and have an open mind to absorb new ideas. Self-motivation, self-discipline, commitment, and the desire and potential to fly and shine above all.
The University of Cambridge looks for students who are really aspiring and are interested in the subjects that they have opted. The university looks for students who are not just chasing after their degrees. The University is focused on the quality of education, and not making students study for their degree.
Application Assessment at University of Cambridge
The University does not prepare any special design or formula for choosing a student to be a part of the Cambridge family. The university tries to give maximum opportunities to students to show their strengths and potential. Each student is considered individually according the following grounds:
- Academic record
- School/college reference
- Personal statement
- Written works
- Contextual data
- Interview
All parts of students data is taken into consideration. Most recent academic record carries the most weight, but the relative importance of each element varies as every student is different. No part of this is isolatedly considered.
Undergraduate Studies
The University of Cambridge has increased the acceptance rate. Number of applications is increasing, and since the acceptance rate is increasing the number of applications accepted by the University of Cambridge is increasing.
Graph depicting the number of Applications received vs the number of offers accepted by the University of Cambridge. The trend shows that with the passage of time, applications have increased and the acceptance has been increasing too. It will be a great opportunity for students across the globe to give their best and apply at the University of Cambridge to reach cloud nine.
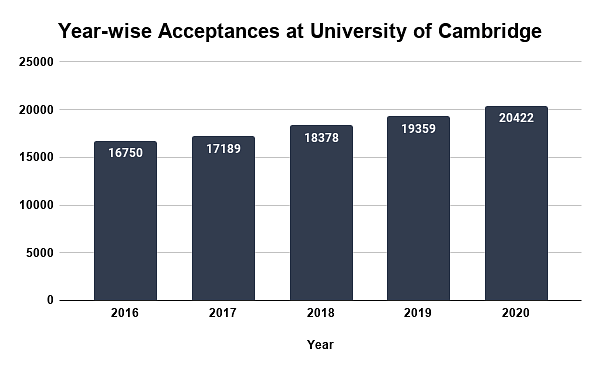
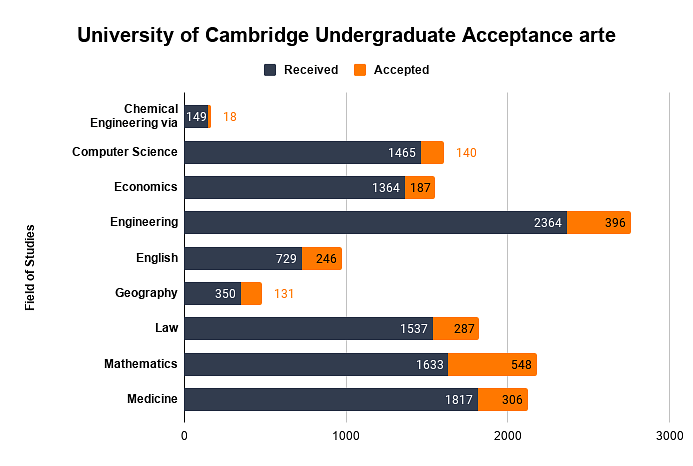
Table Showing Subject-wise acceptance rate of UG programs offered at the University of Cambridge.
| Studies | Applications Received | Application Accepted | University of Cambridge Acceptance rate |
|---|---|---|---|
| Chemical Engineering via Engineering | 149 | 18 | 12.08% |
| Computer Science | 1465 | 140 | 9.56% |
| Economics | 1364 | 187 | 13.71% |
| Engineering | 2364 | 396 | 16.75% |
| English | 729 | 246 | 33.74% |
| Geography | 350 | 131 | 37.43% |
| Law | 1537 | 287 | 18.67% |
| Mathematics | 1633 | 548 | 33.56% |
| Medicine | 1817 | 306 | 16.84% |
Postgraduate Studies
The statistical data extracted from the Postgraduate Admissions Office. It has been charted to provide a statistical analysis of the admission process for matriculated postgraduate programmes. It is based on CamSIS data. Reports on acceptance till 2019-20 academic year onwards are the data provided by the Faculty of Education, Postgraduate Admissions Office, Institute of Continuing Education, Judge Business school.
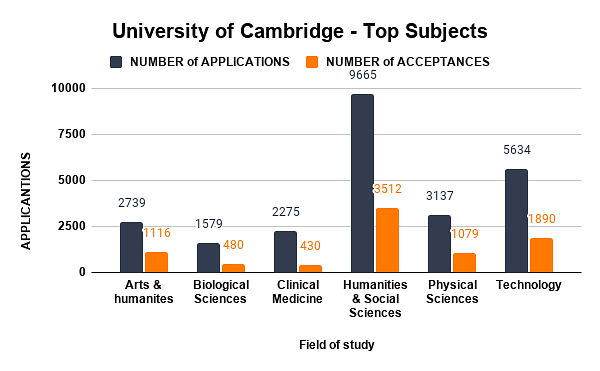
At the University of Cambridge a vast library of subjects are lectured. Some of the most popular are below. A comparison of acceptance rate at the university of the basis of various subjects.
| School | Number of Applications | Number of Acceptance | University of Cambridge Acceptance Rate |
|---|---|---|---|
| Arts & humanities | 2739 | 1116 | 40.74% |
| Biological Sciences | 1579 | 480 | 30.40% |
| Clinical Medicine | 2275 | 430 | 18.90% |
| Humanities & Social Sciences | 9665 | 3512 | 36.34% |
| Physical Sciences | 3137 | 1079 | 34.40% |
| Technology | 5634 | 1890 | 33.55% |
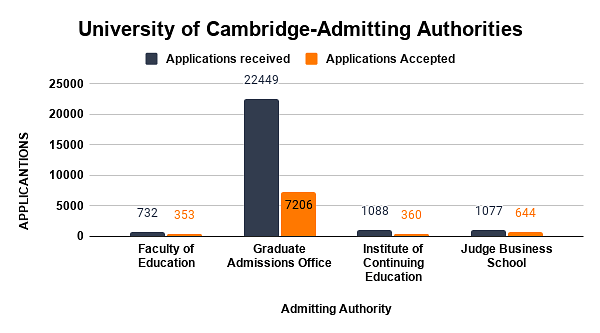
The University of Cambridge has several admitting authorities, they have various acceptance rates as they have their own criteria.
The proportion of total applications, offers, and confirmation by admitting authority which is under the University of Cambridge are as follows:
| Admitting Authority | Applications received | Applications Accepted | Acceptance Rate |
|---|---|---|---|
| Faculty of Education | 732 | 353 | 48.22% |
| Graduate Admissions Office | 22449 | 7206 | 32.10% |
| Institute of Continuing Education | 1088 | 360 | 33.09% |
| Judge Business School | 1077 | 644 | 59.80% |
The University of Cambridge has and always has been unbiased towards gender. As we can see the numbers below both the gender are equally evaluated. As the entire world is trying to secure a place in the prestigious university we have seen that in many cases female applications received by the university is more than the male applications. But as the university is not biased towards any particular gender, there is equal scrutinization of the applications received by the University.
Applications Received & Applications Accepted by Gender, for programmes admitted by all admitting authorities under the University of Cambridge
| Schools | No. of Female Applications | No. of Male Applications | Accepted Female Applications | Male Acceptance Rate |
|---|---|---|---|---|
| Arts & Humanities | 58.00% | 42.00% | 54.80% | 45.20% |
| Biological Science | 56.30% | 43.70% | 57.30% | 42.70% |
| Clinical Medicine | 57.80% | 42.20% | 59.50% | 40.50% |
| Humanities and Social Sciences | 54.60% | 45.40% | 54.80% | 45.20% |
| Physical Sciences | 30.70% | 69.30% | 31.50% | 68.50% |
| Technology | 27.10% | 53.80% | 33.50% | 66.50% |
The proportion of total applications, by admitting authority under the University of Cambridge are as follows:
| Admitting Authority | No. of Female Applications | No. of Male Applications | Female Acceptance Rate | Male Acceptance Rate |
|---|---|---|---|---|
| Faculty of Education | 2.00% | 0.90% | 3.30% | 1.20% |
| Graduate Admissions Office | 42.30% | 46.30% | 43.50% | 47.50% |
| Institute of Continuing Education | 1.90% | 2.40% | 1.80% | 2.70% |
| Judge Business School | 2.90% | 1.40% | - | - |
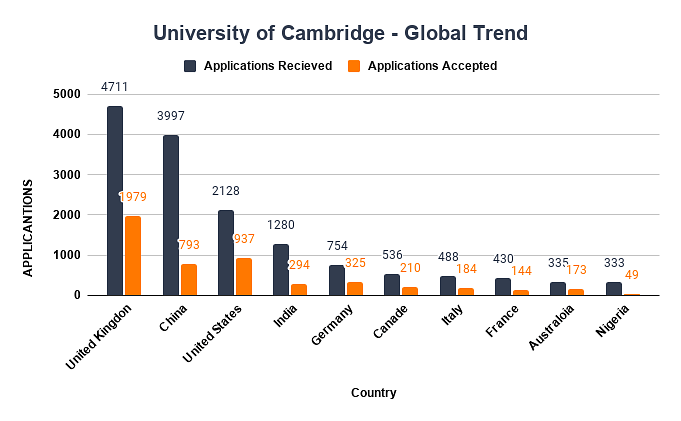
Seeing from the point of global presence within the University. We see applications pouring in from all parts of the world, making the environment diverse and there is a good opportunity to know each other's culture.
Applications by Top 10 declared citizenships for 2019/20 admission, for programmes admitted by the Graduate Admissions Office under the University of Cambridge.
| Country | Applications Received | Applications Accepted | Acceptance Rate |
|---|---|---|---|
| United Kingdom | 4711 | 1979 | 42.01% |
| China | 3997 | 793 | 19.84% |
| United States | 2128 | 937 | 44.03% |
| India | 1280 | 294 | 22.97% |
| Germany | 754 | 325 | 43.10% |
| Canada | 536 | 210 | 39.18% |
| Italy | 488 | 184 | 37.70% |
| France | 430 | 144 | 33.49% |
| Australia | 335 | 173 | 51.64% |
| Nigeria | 333 | 49 | 14.71% |
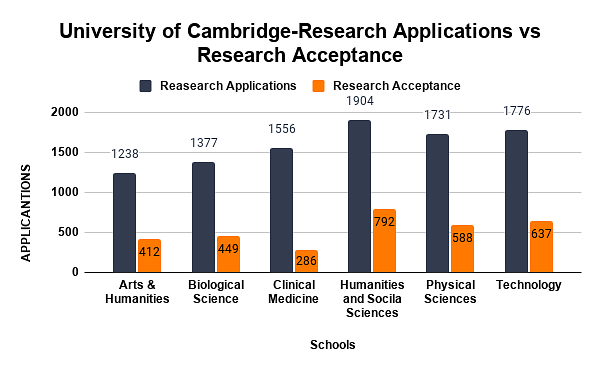
Applications & Offers by School and Programme Definition (research) for 2019/20 admission, for programmes admitted by all admitting authorities under the University of Cambridge.
| Schools | Research Applications | Research Acceptance | Acceptance Rate |
|---|---|---|---|
| Arts & Humanities | 1238 | 412 | 33.28% |
| Biological Science | 1377 | 449 | 32.61% |
| Clinical Medicine | 1556 | 286 | 18.38% |
| Humanities and Social Sciences | 1904 | 792 | 41.60% |
| Physical Sciences | 1731 | 588 | 33.97% |
| Technology | 1776 | 637 | 35.87% |
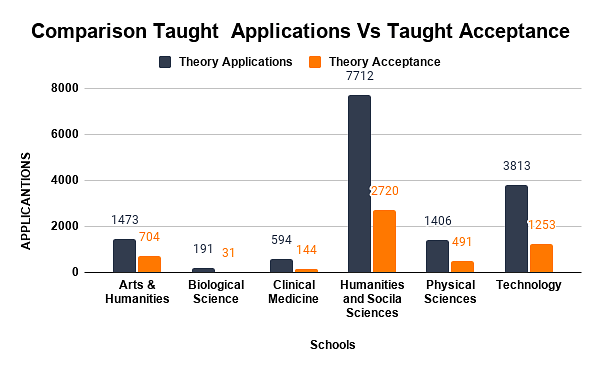
Applications & Offers by School and Programme Definition (Taught) for 2019/20 admission, for programmes admitted by all admitting authorities which are under the University of Cambridge.
| Schools | Taught Applications | Taught Acceptance | Acceptance Rate |
|---|---|---|---|
| Arts & Humanities | 1473 | 704 | 47.79% |
| Biological Science | 191 | 31 | 16.23% |
| Clinical Medicine | 594 | 144 | 24.24% |
| Humanities and Social Sciences | 7712 | 2720 | 35.27% |
| Physical Sciences | 1406 | 491 | 34.92% |
| Technology | 3813 | 1253 | 32.86% |
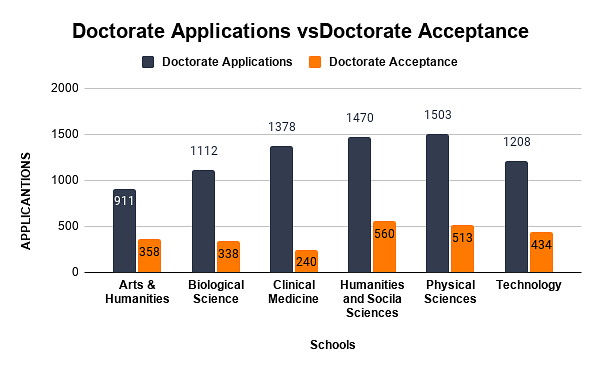
Applications Received vs Applications Accepted by School and Programme Definition (doctoral) for 2019/20 admission, for programmes admitted by all admitting authorities under the University of Cambridge.
| Schools | Total Doctorate Applications | Total Doctorate Acceptance | Total Acceptance Rate |
|---|---|---|---|
| Arts & Humanities | 911 | 358 | 39.30% |
| Biological Science | 1112 | 338 | 30.40% |
| Clinical Medicine | 1378 | 240 | 17.42% |
| Humanities and Social Sciences | 1470 | 560 | 38.10% |
| Physical Sciences | 1503 | 513 | 34.13% |
| Technology | 1208 | 434 | 35.93% |
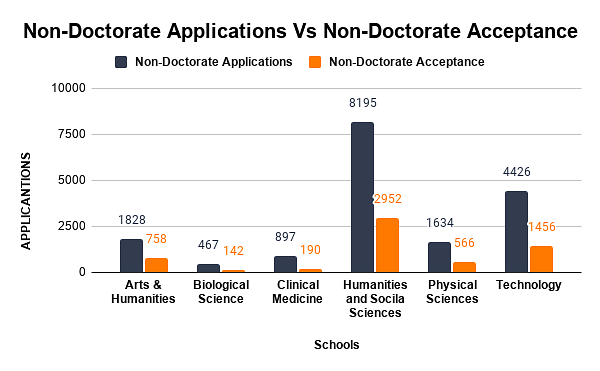
Applications Received vs Applications Accepted by School and Programme Definition (Non-doctoral) for 2019/20 admission, for programmes admitted by all admitting authorities under the University of Cambridge.
| Schools | Total Non-Doctorate Applications | Total Non-Doctorate Acceptance | Total Acceptance Rate |
|---|---|---|---|
| Arts & Humanities | 1828 | 758 | 41.47% |
| Biological Science | 467 | 142 | 30.41% |
| Clinical Medicine | 897 | 190 | 21.18% |
| Humanities and Social Sciences | 8195 | 2952 | 36.02% |
| Physical Sciences | 1634 | 566 | 34.64% |
| Technology | 4426 | 1456 | 32.90% |
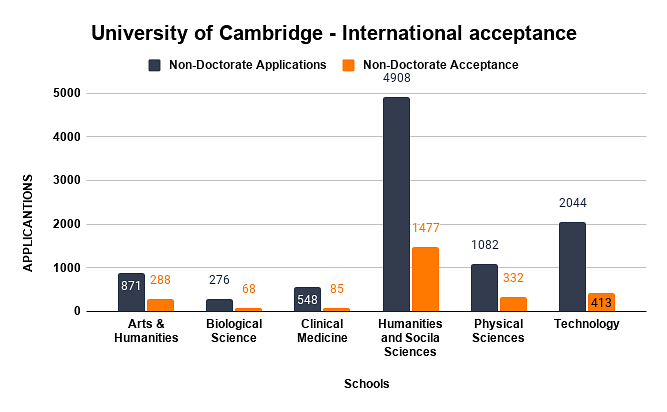
Non-Doctoral International Applications received vs International non-doctoral acceptances by School for 2019/20 admission, for programmes admitted by all admitting authorities excluding the Judge Business School and certain programmes admitted under the University of Cambridge.
| Schools | International Non-Doctorate Applications | International Non-Doctorate Acceptance | International AcceptanceRate |
|---|---|---|---|
| Arts & Humanities | 871 | 288 | 33.07% |
| Biological Science | 276 | 68 | 24.64% |
| Clinical Medicine | 548 | 85 | 15.51% |
| Humanities and Social Sciences | 4908 | 1477 | 30.09% |
| Physical Sciences | 1082 | 332 | 30.68% |
| Technology | 2044 | 413 | 20.21% |
Similar Colleges


Robert Gordon University


University of Aberdeen


Aberystwyth University


University of Bath


Cranfield University


Queen's University Belfast


Ulster University


University of Reading


Aston University
interested in this College ?
Follow & Share this college to get information about admission.
| Program | Important Dates |
|---|---|
| M.Phil Industrial Systems, Manufacturing, and Management | Application Deadline For 2024 Intake (16th May 2024) |
| M.Phil Strategy, Marketing and Operations | Application Deadline For 2024 Intake (28th Apr 2024) |
| M.Phil Engineering | Application Deadline For 2024 Intake (16th May 2024) |
| M.Phil/Ph.D CDT/Computational Methods for Materials Science | Application Deadline For 2024 Intake (16th May 2024) |
| M.Phil Music | Application Deadline For 2024 Intake (16th May 2024) |
| M.Phil Micro and Nanotechnology Enterprise | Application Deadline For 2024 Intake (16th May 2024) |

 University of Bath
Bath, England
- University of Oxford
Oxford, England
- University of St Andrews
St Andrews, Scotland
- Imperial College London
London, England
- The University of Manchester
Manchester, England
- London School of Economics and Political Science
London, England
- University of Edinburgh
Edinburgh, Scotland
- University College London
London, England
- Cambridge Judge Business School
Cambridge, England
- University of Birmingham
Birmingham, England


Comments